
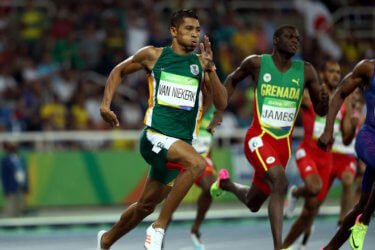
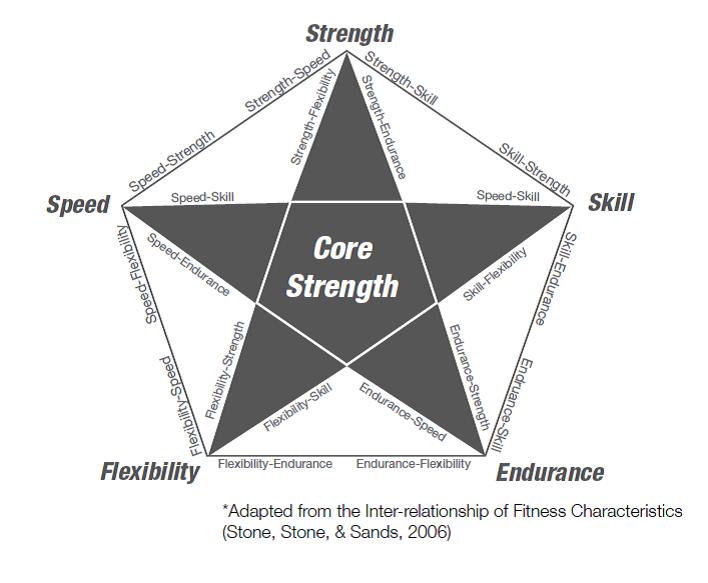
The 400 meters (obviously biased, but is the best event!) is usually known as “The Killer Event” a speed endurance event that demands a capacity to maintain close to maximum speed in an effort of » 45 seconds duration. Vittori (1991) identifies the fundamental functional requisites for success in this event as a combination of strength, speed and endurance plus an appropriate effort distribution. As suggested by Harre and Leopold (1987), in speed endurance and short middle distance events, strength endurance is the speed strength support for these cyclic movements and therefore is a determinant of the competitive performance.
This article first appeared as part of the IAAF Sports Research in 2004 written by By Paulo Jorge Paixão Miguel and Victor Manuel Machado Reis

Nummela et al. (1992) have studied the effects of fatigue on sprinters performing a 400m race. On different days subjects ran 400m, 100m, 200m and 300m respectively as if they where running the event (i.e. with the same pace strategy). To evaluate the strength level decrease, the subjects performed a drop jump test (from 39cm height) after the end of each of the referred distances. Comparing rest values with the those after the runs it was possible to verify the deteriorating force production over the event. After the 300m there was a 16% drop and after the 400m a 25% decreased was observed. Moreover, the authors found a linear negative relationship between jump height and lactate levels above 6mmol/l.
These results and the results from Nummela et al. (1994) suggest that during the first 200m of the race muscle properties are modified (reflected by an increase of contact time and a decrease of explosive strength in the height of jump) even without a decrease in the running speed. However from the 200- 300m onwards there is a strength reduction, as capillary lactates concentration attains more than 6mmol/l, and the pH drops. Additionally, it is possible to observe an increase of the electromyographic record (EMG) of the muscles that participate in the sprinting action. This increase in EMG activity during the 400m is caused by the increase in the firing rate and/or the recruitment of additional motor units to compensate for failure in contractile capacity of muscle fibers that have already been recruited (Nummela et al. 1994). In the same study, the authors have found that during the last phase of the event, ground reaction forces decreased remarkably during the braking phase, which implies that the musculotendon system reduced capacity to tolerate impact forces.
The differences found by the authors between a sub-maximal 20m run at competition pace and the end of the 400m run suggests possible changes in stiffness regulation. This possible failure in stiffness characteristics may reduce the storage of elastic energy during the braking phase. Indeed, once the strength capacity progressively decreases during the event (Nummela et al. 1992 and 1994; Hirvonen et al. 1992), due to metabolic changes (Arcelli, 1995; Lacour et al. 1990) or to FT fibers failure (Nummela et al. 1994), strength endurance (SE) will prevail as the determinant of success in this event. The greater the ability of the athlete to oppose fatigue (by maintaining strength levels), the smaller the drop in speed and consequently the better the performance (Harre & Leopold, 1987). Therefore, SE seems to be a determinant factor in 400m performance and athletes with the best performances in the event should also be able to express more power in sprint specific strength components, i.e. explosive strength (Es), reactive strength (Rs) and especially Es endurance or speed strength endurance (SSE).
Until the present time, several studies with distinct populations have been performed in order to investigate the strength components and their importance in sprint events (Num- mela et all, 1992; Delecluse, 1997; Locatelli, 1996; Manou et all, 2000; Chelly & Denis, 2001; Henessy & Kilty, 2001; Miguel, 2003). However, we have found no data on differences of the strength levels in 400m runners from distinct performance levels.
The main aims of the present study were to identify differences in Es, Rs and SSE, between two groups of 400m runners with distinct performance levels and to identify associations between each strength component and 400m performance (t400) in speed endurance athletes.
Methods
Subjects
Fifteen elite male runners, 400m and 400m hurdle specialists, volunteered to participate in the present study, after being informed about the aims, risks and advantages of their participation. The athletes were assigned in two groups according to their performance level. One group (up49) included the athletes with a 400m season best (t400) above 49s (n=9; t400=49.86 ±0.43s; age=19.44±1.124yr) and the other group (sub49) includ- ed the athletes with a t400m below 49s (n=6; t400=47.66 ±0.60s; age=24.17 ±3.48yr).
Procedures
All subjects were evaluated at the end of the Preparatory Phase for three consecutive sea- sons. Before the experiments, the subjects were familiarised with the testing procedures. The subjects were instructed not to engage in high-intensity training during the 48 hours prior to the testing session. The testing session included three tests to evaluate Es, Rs and SSE according to Bosco (1994) in the following sequence: three attempts of a counter movement jump (CMJ), with a two minutes rest between attempts, where the best performance was recorded; after a three minutes rest, a stiffness test that included 15 reactivity jumps (15React); after a four to five minutes rest a 30 seconds continuous CMJ (30CMJ). An ergo jump system (Bosco System, Globus, Italy) and the respective software (Ergo Tester) were used. All the tests were performed in identical conditions, i.e. in indoor rooms with a range of temperatures between 18 and 25ºC and at the same time of day. The reliability of the tests and instrument was calculated following the author’s indications (Bosco, 1994) and from Ayestaran and Calbet (2001). In the CMJ, the coefficient of variation true repetition of the test was 0.11% (22 subjects) and in the 15React it was 0.16% (10 subjects). For continuous jumps reliability, we used two mat platforms, one above the other, in 273 jumps performed by 4 subjects. Then we correlated flight times and contact times, which were respectively r=0.950 (p<0.001) and r=0.997 (p<0.001).
Calculations
Based on the several parameters assessed during the above mentioned tests, the following variables were considered: height of the rise of the centre of mass (cm) obtained in the CMJ test (hCMJ), maximum and average val- ues of the estimated power during the 15React (Pmax Rs and Pmed Rs) and average values of heights of the rise of cm of total and partial parts in the 30CMJ test, i.e. total and each half (h30CMJ, h0.15 and h15.30).
The calculation of the height of the rise of the cm (h) was estimated from the flight time of each jump, according to the Asmussen and Bonde-Petersen formula (Bosco, 1994):
h= tv_x1.226 (1)
in which tv is the flight time.
In the 15React, the Mechanical Power of each jump was calculated using the Bosco- Vittori formula (Gallozi, 1996):
W= 19.86 x tv (2)
Tc
in which Tc is the contact time.
Pmax Rs was achieved from the average result of the three best jumps, just as Locatel- li (1996) did, and the Pmed Rs from the aver- age of all jumps.
Data Analysis
Data was analysed with SPSS 11.0 software (SPSSScience, Chicago, USA) and the graphics were designed with Sigma-Plot 8.0 software (SPSS Science, Chicago, USA). Simple and multiple linear regressions were used on all appropriate data. The normality of the distribution of the variables was checked with the Kolmogorov-Smirnov Test. Mean differences were tested by an Independent SamplesT-test. The associations between variables were determined by the Pearson Product Moment Correlation Coefficient. The statistical significance was set to p£0.05. The results are presented as means ± standard deviations (SD)
Results
The mean values of the two groups are presented in Table 1. The sub49 group obtained the best averages in all variables of the Es and Based on the several parameters assessed SSE but not in the Rs. Table 2 presents mean differences between the two groups studied.
Taking into account the results from all the subjects, associations between t400 and the following variables were found: hCMJ (R=- 0.68; p<0.01; SEE=0.92), h30CMJ (R=-0.75; p<0.01; SEE=0.82), h0.15 (R=-0.64; p<0.01; SEE=0.95) and h15.30 (R=-0.76; p<0.01; SEE=0.81).
Table 1: Mean Values of thesubjects in theCMJ (hCMJ), 15React (Pmax Rs and Pmed Rs) and 30CMJ(h30CMJ, h0.15 and h15.30) tests.Values aremeans (±SD)
| Test sub49 up49
CMJ hCMJ (cm) 54.95 ± 2.497 46.39 ± 4.841 |
| 15React
Pmax Rs (watt/kg) 76.95 ± 6.862 78.76 ± 10.420 Pmed Rs (watt/kg) 69.75 ± 6.209 69.84 ± 9.205 |
| 30CMJ
h30CMJ (cm) 41.84 ± 1.956 37.15 ± 2.226 h0.15 (cm) 43.96 ± 3.308 39.54 ± 2.732 h15.30 (cm) 39.68 ± 1.421 34.82 ± 2.231 |
Table 2: Mean differences between the two groups,significance level and the confidence interval (95%) inCMJ, 15React and 30CMJ tests
|
|||||||||||||||||||||||||||||||||||||||||||||||||||||||||||||
Discussion
The mean values we have observed on the CMJ (54.95cm and 46.39cm, respectively for the sub49 and up49) are consistent with the literature (Rusko et al., 1993; Numella et al., 1996; Badillo and Gorostiaga, 1997). In the 30CMJ, our mean values (41.84cm and 37.15cm, respectively for the sub49 and up49) are also consistent with a previous study (Miguel, 2003), although information regarding this data is scanty.
The sub49 presented a better performance, comparatively than the up49, as shown by a significant mean difference of 4.41% in the t400. Significant differences between the two groups were also observed for all measures of the height of the rise of the cm (hCMJ, h30CMJ, h0.15 and h15.30), which correspond to explosive strength (Es) and to speed strength endurance (SSE) components (see Table 2). The sub49 presented higher mean values and the differences between groups in those variables represented was between 10.06% and 15.58%.
These results may suggest that to obtain significant improvements in performance, the development of Es and the SEE should be more than 10%. However, additional data from longitudinal studies with 400m runners is warranted to support this suggestion. Moreover, the differences between groups were larger on the second half of the 30CMJ, which emphasises the need to develop SSE to attain top-level performance over 400m, as suggested by Harre & Leopold (1987).
We have found significant associations between t400 and hCMJ (R=-0.683; p<0.01) and between the t400 and h30CMJ (R=-0.753; p<0.01) when data from both groups were pooled together (see Figure 1). In a previous study (Miguel, 2003), we have also found a significant association between t400 and h30CMJ (R=-0.910; p<0.005). When hCMJ and h30CMJ were included together to identify the association with the t400, a significant association was found (R=-0.76; p<0.01; SEE=0.84). However, those associations were not present when each group was analysed separately. Therefore, we can hypothesise that those indicators of Es and SSE may be sensitive to differences in the competitive level only when a large variation in performance is present. Nevertheless, since the measurements that we have performed were not necessarily coincident with each subject’s peak performance, additional data is required to confirm our hypothesis.
The indicators of Rs that were measured during the 15React test (PmaxRs and PmedRs) were not significantly different between groups (see Table 2) and large differences were observed for these variables. Additionaly, there were no differences between the PmaxRs and the PmedRs, a fact that suggests that a 15 jump test may be insufficient to indicate the subjects´endurance ability in the Rs component. Moreover, those variables were not able to discriminate the subjects from the two groups. Some authors set emphasis on the importance of the reactive strength (or leg stiffness) to maximal sprinting speed (Vittori, 1996; Chelly & Denis, 2001).
Additionally, it has been suggested that reactive strength (measured by 7 jumps) is associated with maximal speed and speed maintenance in sprint events – 60m, 100m and 200m (Locatelli, 1996; Lacour, 1996). It has also been suggested that performance in 400m events is dependent on the subjects’ maximal sprinting speed (Mero et al., 1993; Rusko et al., 1993; Numella et al., 1996). However, we have not found any association between the results in the 15React test and t400. Therefore, we may conclude that Rs itself may not be a valid predictor of performance in the 400m.

Conclusion
The main finding of the present study was that 400m runners with different performance levels present different levels of Es (as indicated by performance in the CMJ) and of SSE (as indicated by the performance in the 30CMJ). Furthermore, we found that the Es and the SSE may only be able to discriminate 400m runners when a large variability of performance is present.
Therefore, the development of these two strength components seem to be an important issue to consider when designing preparation programmes for 400m runners.
Empirically, we know that in their regular training programmes 400m runners usually include the following contents for strength improvement (Miguel, 2002): jumps, weight training, technique exercises and exercises to improve running specific-strength and exercises for general conditioning. In events where the performance warrants a combination of strength and endurance (events lasting less than one minute), the training aims at the development of: i) endurance and aerobic strength endurance; ii) maximal strength and explosive strength; iii) explosive strength at high speed; iv) strength endurance and specific strength (Badillo and Serna, 2002). To Bosco (2000) the distinct strength components mentioned above are commonly developed in sequence and in successive cycles in which a stage or block evolution are expected.
The author suggests that the SSE should be developed in order that the maximal strength, the explosive strength and the SSE should take place in a concurrent way.
Whatever the training programme model chosen by their coaches, we suggest that 400m runners should take special care to perform exercises that aim to develop Es and SSE. Thus, according to the suggestions of Bosco (1994, 2000) and Vittori (1991), some of the exercises that can be used in order to develop Es are as follows:
-
Jumps: simultaneous or alternate short bounds; horizontal continuous-bounds (hops, steps, combined); drop jumps (over hurdles; with or without knee pick-up); CMJ (with and without additional loads); half-squat jump (loads from 20 to 40% of body weight).
-
Weight training (any load moved at maximum speed): squat and half-squat, splitsquat, step-ups.
-
Technical exercises (used to improve sprinting technique and with an effect on reactive strength): drills; skipping, fast rhythm exercises; stand body segment exercises; progressive runs; exercises to improve running specific-strength (sprint resistance methods: up-hill sprinting,sprints against resistance, weight belts,sand sprints).
Concerning SSE development, it seems there is some controversy regarding which methodology to use. However, we find the proposal of Cometti (2001) interesting. The author suggests that the exercises should include some general strength followed by the competition movement in a way that the total exercise duration replicates the competitive event. For example: a 400m runner could perform a typical weight training movement (half squat, 10 RM maximum) followed by an 80 to 100m sprint and repeat the sequence 3 times, which means 50 to 60 seconds total duration of the exercise. Donati (1996) also supports this type of combined exercises when the aim is to associate the strength work with the specific speed work (these “associated exercises” can be modulated in major or minor preponderance of strength or speed according to the aims and needs and the possibility to develop several strength components in an exercise sequence).
References
1. AYESTARAN, E.G.; CALBET, J.A. L.: (2001)
Evaluación del Deportista de Alto
Rendimiento Deportivo. Madrid. COES/UAM.
2. ARCELLI, E.: (1995) Acido Lattico e
Prestazione – Quello che lállenatore deve
sapere. Pavia. Coop Dante.
3. BADILLO, J.G.; GOROSTIAGA, E.: (1997) Fundamentos
del Entrenamiento de la Fuerza,
Aplicación al ARD. Barcelona. Inde.
4. BADILLO, J.G.; SERNA, J. R.: (2002) Bases de
la Programación del Entrenamiento de la
Fuerza. Barcelona. Inde.
5. BOSCO, C.: (1994) La Valuración de la fuerza
com el test de Bosco. Barcelona. Paidotribo.
6. BOSCO,C.: (2000) La Fuerza muscular –
Aspectos metodológicos. Barcelona. Inde.
7. CHELLY, M.; DENIS, C.: (2001) Leg power and
hopping stiffness: relationship with sprint
running performance. Med. Sci. Sports
Exerc., 33: 326-333.
8. COMETTI, G.: (2001) Los Métodos Modernos
de Musculación. Barcelona. Paidotribo.
9. DELECLUSE, C: (1997) Influence of strength
training on sprint running performance –
Current findings and implications for training.
Sports Med. 24, 3: 147-156
10. DONATI, A.: (1996) The association between
the development of strength and speed.
New Studies in Athletics. 2-3: 51-58
11. GALLOZZI, C.: (1996) La Valutazione della
Forza. Sds- Riv. Cult. Sportiva. XV, 34: 22-35
12. GARCÍA MANSO, J.M.; NAVARRO V., M.;
RUIZ CABALLERO J.; ACERO, R.: (1998) La
Velocidad. Madrid. Gymnos.
13. HARRE, D.; LEOPOLD, W.: (1987) La
Resistenza alla forza – definizione della
capacità di resistenza alla forza e principi
fondamentali del suo allenamento (parte
prima). Sds- Riv. Cult. Sportiva. VI, 9: 28-
35
14. HENNESSY, L.; KILTY, J.: (2001) Relationship
of the stretch-shortening cycle to sprint
performance in trained female athletes.
Journ. Strength & Cond. Research. 15, 3:
326-331
15. HIRVONEN, J.; NUMELLA, A.; RUSKO, H.;
REHUNEN, M.; HÄRKÖNEN, M.: (1992)
Fatigue and changes of ATP, , creatine phosfate
and lactate during the 400m sprint.
Can. J. Sport Sci.. 17, 2: 141-144
16. LACOUR, J.R.; BOUVAT, E.; BARTHÉLÉMY,
J.C.: (1990) Post-competition blood lactate
concentrations as indicators of anaerobic
energy expediture during 400m and 800m
races. Eur. J. Appl. Physiol. 61: 172-176
17. LACOUR, R.: (1996) Physiological analysis of
qualities required in sprinting. New Studies
in Athletics. 11, 2-3: 59-62
18. LOCATELLI, E.: (1996) The importance of
anaerobic glycolysis and stiffness in the
sprints (60m, 100m and 200m). New Studies
in Athletics.11, 2-3: 121-125
19. MANOU, V.; KELLIS, S.; ARSENIOU, P.: (2000)
Relationship between 100m sprinting performance
and jumping ability. 5th Annual
Congress of ECSS. Jyväskylä
20. MERO, A.; RUSKO, H.; PELTOLA, E.; PULLINEN,
T.; NUMELLA, A.; HIRVONEN, J.: (1993)
Aerobic characteristics, oxygen debt and
blood lactate in speed endurance athletes
during training. Sports Med Phys Fitness.33,
2: 130-6
21. MIGUEL, P.P.: (2002) Planeamento do treino
para corredores de 400m. Treino Total. 4, 2:
19-24
22. MIGUEL, P.P.: (2003) Manifestações de Força
na corrida de 400m e sua relação com o
rendimento. II Simpósio “ Treino e Avaliação
da Força e Potência muscular”. Maia. ISMAI
23. NUMELLA, A.; MERO, A.; STRAY-GUNDERSEN,
J.; RUSKO, H.: (1996) Important determinants
of anaerobic performance in male
athletes and non-athletes. Int. J.
SportsMed.17,supl 2: s91-6
24. NUMELLA, A.; RUSKO, H.; MERO, A.: (1994)
EMG activities and ground reaction forces
during fatigue and nonfatigued sprinting.
Med. Sci. Sports Exerc.. 26, 5: 605-609
25. NUMELLA, A.; VUORIMA, T.; RUSKO, H.:
(1992) Changes in force production, blood
lactate and EMG activity in the 400m sprint.
J. Sport Sci.. 10: 217-228
26. RUSKO, H.; NUMELLA, A.; MERO, A.: (1993)
A new method for the evaluation of anaerobic
running power in athletes. Eur. J. Appl.
Physiol. 66 (2): 97-101
27. VITTORI, C.: (1991) The development and
training of young 400 metres runners. New
Studies in Athletics. 6, 1: 35-46
28. VITTORI, C.: (1996) The European School in
sprint trainning– The experience in Italy.
New Studies in Athletics. 11, 2-3: 85-92